Tuesday, December 2, 2014

Merging vector features in QGIS

QGIS is a free and open source geographic information system. At SilviaTerra, our clients often need to merge features in their vector files by metadata. We use QGIS to do this quickly and easily.

For example, this shapefile has 25 stands.


However, each has one of four values for its WTS_STAND metadata column.


We will merge them into four stands, one for each WTS_STAND value. Click Vector -> Geometry Tools -> Singleparts to multipart


For the Unique ID field, select WTS_STAND.


Click OK, and you're finished!


Wednesday, November 5, 2014

Volume reports are back and better than ever!

We are excited to tell you that we have just finished switching Plot Hound volume reports over to a more localized and more accurate volume calculation method. If you’ve submitted a volume report in the past few weeks, you may have noticed that it took a long time to get the report back.  We’d like to thank you for your patience. Reports are not only back on track now, but better than before! The long explanation for what we did, and why it matters for you and your work, will be discussed in blog posts for the rest of this year. If you have any questions about your new (or old) reports, send us an email or leave a comment below!

Friday, October 10, 2014

Advanced Search and Filtering

Hot on the heels of our last update (Improved Cruise Page), we're rolling out another big improvement to the Plot Hound web interface: advanced searching and filtering.  Now it is easier than ever to find the cruises and stands you're looking for.


When you click the "Cruises / Stands" link at the top of your Dashboard page, you'll see a list of your stands.  Click the green "Add Filter" button to start narrowing things down.  You can filter by cruiser, cruise status, start date, finish date, county, tag, and stand name.

As our own collection of stands and cruises has grown into the thousands, we found ourselves needing a way to handle the explosion of data.  Tags and this new filtering feature have made our lives much happier!

Monday, October 6, 2014

Improved Cruise Page

We're rolling out lots of improvements to the Plot Hound website over the next few weeks.  Last week we launched a brand new cruise dashboard so you can keep tabs on your pending cruises.  This week, we're excited to go live with a cruise page.  We've totally redesigned the cruise page to be information rich, yet well-organized and easily digestible.


One of the first things you'll notice is that we've made the stand map much smaller to make room for the cruise info bar and the plot tally that now makes up the bottom half of the page.  You can still explore your stand by clicking the "expand" link to get a full-screen map view.

We've made the links to download your cruise KML, GPX, or shapefile more prominent and added the option to drop all incomplete plots - useful for when you decide to only measure a subset of your original plots.

The biggest change is the plot tally now displayed at the bottom of the page.  You can view the status of individual plots and even click the "details" link to see the trees that were measured:


When your cruise is complete, all of your graphs and reports are prominently displayed and available for download.  Clicking on a graph expands it and opens up a carousel that you can click through to see all of your graphs up close.


The new cruise page has changed the way we manage our own cruises and hope you find it useful as well!

Tuesday, September 30, 2014

Launching Plot Hound Dashboard

Today we're excited to announce the latest improvement to the Plot Hound experience - a new web dashboard for tracking cruise progress across your entire team:


We built the dashboard because we do a lot of cruises but didn't have a quick and easy way to answer the questions:

  • Which cruises got finished this week?
  • Which cruises are almost done?
  • Which cruises aren't started yet?
  • When will a particular cruise be done?

With the new Plot Hound dashboard, we can answer all of these questions at a glance.  High-level stats about your cruise productivity are displayed prominently.  Each of your recently completed and in-progress cruises is displayed in an data-rich card with information about the start date, cruiser, acreage, number of plots, progress, and an estimate of the completion time.

The dashboard has already improved our workflow here at SilviaTerra and we hope it's helpful for you as well!

Monday, August 25, 2014

New Plot Hound video tutorial


Today we're excited to publish our updated Plot Hound tutorial video.  Check it out below to start cruising in less than 5 minutes!


As always, please don't hesitate to get in touch with us if you have any questions about Plot Hound.


Saturday, August 9, 2014

SilviaTerra in the Scientific American

SilviaTerra was just featured in an article about next-generation forestry in the Scientific American.  We're dedicated to pushing the state-of-the-art forward and are excited to contribute to the future of data-driven forestry.


Zack and his trusty Plott Hound Zoey at plot center

Tuesday, July 22, 2014

Offline Mapping in Plot Hound

Today we're excited to announce another much-requested feature: Offline Mapping.

It's no fun to be out cruising without a map.  Now Plot Hound makes it easy for you to cache aerial imagery of your stand so that you can always see a map - even when you don't have a data connection.

Here's how it works:


Click the download button in the top right of the Cruise page


You'll see the button start spinning, and then you'll get a message that your download is complete


Aerial imagery will be downloaded to your phone and will be displayed on the Map page

Plot Hound caches multiple zoom levels, so you can zoom all the way in to your stand, or all the way out to the surrounding area.

Right now, the offline mapping feature is limited to stands that are 60 acres or smaller.  It's also somewhat experimental, so please let us know if it gives you any trouble!  We're also working on adding topographic data to the aerial imagery as well.

As always, we're looking forward to your feedback - please leave a comment below!

Wednesday, July 2, 2014

The importance of selecting species

The newest version of Plot Hound includes an important change for species data collection.  This change is partially to help you improve the quality of your own data, and partially to ensure that we can generate the best possible estimates of heights and volumes from your cruise data when you want them.  

We are removing the option of recording trees at the genus level.  In other words, “Birch spp.” and “Pine spp.” will no longer be available in the species lists- instead, you’ll have to identify if that tree is a yellow birch or a black birch, and distinguish between a loblolly and a pitch pine.

We know from past cruises that the “spp.” option is used rarely. Of all cruises that have been done using Plot Hound, 1% of all plots had a “spp.” tree, and 6% of all cruises had a plot with a “spp.” tree.  So this change may not have a major impact, but it might force you to develop new habits if you’re cruising in the Southeastern US and used to recording all those southern yellow pines as “Pine spp.” (Pro tip: if you really aren’t interested in that species distinction, just pick one of the SYP species and use it for all the pines you measure.)

Photo credit: Travis Pond
Identifying trees down to the species level is a cruising “best practice” that’s worth making a habit.  When you make that identification call in the field, you’re doing it with the most information you’ll have available to you.  You can see the tree’s growth form, get up close to the bark, see the leaves on the tree and on the ground (or find some under the snow!), look for seeds and twigs, and get a good sense of the site where it is growing.  Whenever I’ve taken pictures or collected leaves and thought “I can just ID that tree when I get back tonight”, inevitably I’ve gotten back to my office and wondered what in the world I was thinking - those pictures never show what I need, and the leaves out of context are often more confusing than helpful!  If you’re cruising with Plot Hound on your phone, you could also add one of the great Tree ID apps out there and have all the information you need available in the woods, or you could add notes in the “notes” section for that tree to remind yourself to confirm your ID back in the office (for example, “Maybe yellow birch. Took picture of bark and leaves”). No need to fill your cruisers vest with plastic bags of bits of trees to puzzle over later.

Having trees identified down to the species level is critical to generating the best possible estimates of heights and volumes.  Different species within a genus can have extremely different growing conditions, growth rates, and growth forms - we wouldn’t expect a height model fit to both jack pine and red pine in the Great Lakes area to provide good estimates. Having trees identified down to the species also makes our height estimation more accurate - a process that leverages stand-level information on species mixtures and location to generate species-specific height models to provide the best possible fit for your data.

As always, we welcome your feedback, so feel free to respond with comments below!

Monday, June 30, 2014

Dropping incomplete plots

Starting today, you'll be able to drop incomplete plots from a cruise.  When you go to a cruise page on the website, you'll see a new orange button "Drop incomplete plots" that shows up after you've completed at least one plot.


A word of warning though - you may bias your sample by dropping plots.  Unless you're dropping plots in a completely random or completely systematic manner, you are likely biasing your sample.

So if you drop every third plot, your sample will be unbiased (although you may not hit your target accuracy and confidence for the cruise).

However, if you drop all the wet plots, the plots furthest from your truck, or plots with bees on them, you are biasing your sample.  In that case, the estimates derived from your cruise data would be for a population that did not include the areas you chose not to sample.  This is likely not what you want!

Friday, June 20, 2014

Manage groups of stands with tags

More and more large forestry companies have started using Plot Hound to collect their cruise data.  We've received many requests for a better way to organize groups of stands into units like "Northern Section", "2014 Harvest", "Smith Property", and "Restricted Stands."  Today, we're announcing "tags" - a new feature that makes it easy to organize your stands.

You can think of tags as like fields in your GIS attribute table, only more intuitive. You can add the same tag to multiple stands, which allows you to easily group related stands, strata, blocks, owners, forests, you name it!


When creating a stand, you can start typing and create any tag you would like. If you have already created a tag all you have to do is type a few letters and the drop down box will suggest tags that you have already created with a similar name, or you can create a tag with a new name. To create or select a tag, just click the choice from the drop down, or press enter/return on the highlighted choice.


On the stand and cruise page, you can now also use the search box to search for tags. Tags will be displayed in the new column titled tags.


If you click a tag from the column, it will automatically search for other items with that same name. This makes it easy to see multiple stands with the same tag. 


On the cruise list and detail page, you will be able to see the tags of the stand which that cruise belongs to. If you click a tag on the cruise detail page, it will take you to the cruise list page, and filter the cruises table to show you other cruises whose stands have the same tag.


You can remove or add tags on the stand detail page too.  To remove a tag, simply push the "x" button next to the tag name. To add a tag, just type the name of the tag you would like to add or create and select it from the drop down. Once you are satisfied with your edits, push save and they will be applied. If you click on a tag from this page, it will take you to the stand list page, and filter the stands table to show you other stands with the same tag.

We're excited to see how you use tags.  As always, please tell us what you think in the comments section below!

Tuesday, June 17, 2014

Setting up a cruise: Bringing the pieces together

In recent posts we’ve talked about how the set-up of a cruise is influenced by your requirements for confidence and error, and the variation you anticipate in the stand.  The total number of plots in a cruise is calculated using a standard sample size formula, which you might remember from a forest measurements class:


n = ( t * CV )2
A


Or, in simpler terms:


number of plots = ( t-statistic * Coefficient of variation )2
Allowable error

The t-statistic comes from the level of confidence you specify.


The criteria you specify are used in that equation to determine the final number of plots- generally, here’s how that works:


More plots:
Fewer plots:
Higher confidence required
Lower confidence required

Because the t-statistic (reflecting confidence) and the estimated variation are multiplied, if you require a high level of confidence in results from cruising a highly variable stand, the number of plots required will be much larger than if you need an estimate with lower confidence, or if the stand is less variable. The final plots are then located in a grid across the stand. 


Once you know where to go, the next challenge becomes how to decide what data to collect and what plot design to use- fixed area plots, or strips of varying sizes, or a variable-radius plot.  We’ll get into that in a future series of posts!


Wednesday, May 21, 2014

Setting up a cruise - Allowable Error

When you plan a cruise, you’re usually planning to answer a specific question - how much merchantable material would come out if I thinned this stand?  Is stocking high enough for a selection harvest?  Should I buy/sell this property?  How much is this tract worth?


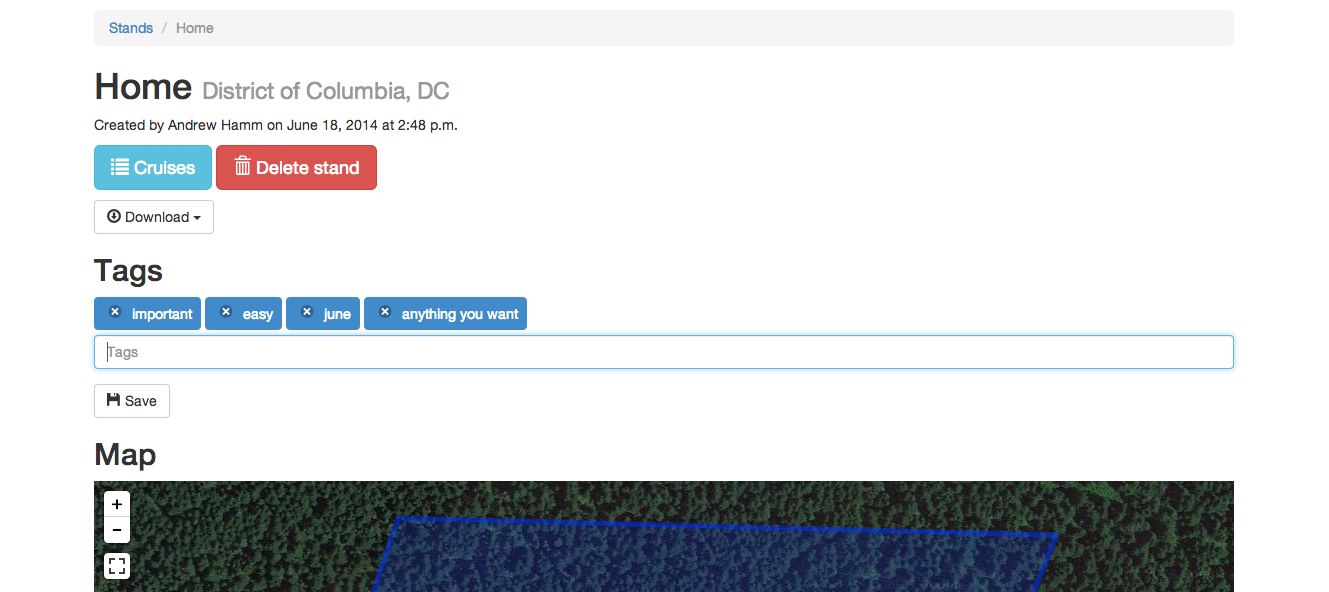
When setting up a cruise on SilviaTerra.com, the number of plots in a cruise depends on the level of confidence you want in the answers, and the amount of error in the estimates you decide is acceptable. How do you go about choosing what error and confidence you prefer?  To answer that question, you might ask yourself another: how much does it cost you if your cruise answers your question “incorrectly"?

If you try changing the values for confidence and error, you can see that decreasing confidence and increasing error both result in fewer plots in the cruise layout, and increasing confidence or decreasing error results in more plots. The allowable error is the precision you require for your final stocking estimates.  The confidence is the probability that your final estimate ± a confidence interval contains the true mean for the stand (what you would get if you measured every single tree).
          
There is a tradeoff between the cost of measuring plots and the cost if your estimate is “wrong”. Measuring plots also costs you both time and money.  Consider an example of a 100 acre stand with an estimated variation of 0.25. 

Plots
Cost to cruise ($50/plot)
Confidence
Allowable Error
17
$850
0.9
0.1
5
$250
0.9
0.2
2
$100
0.9
0.3

We’ll assume a stumpage price of $100/MBF.

If the merchantable volume in the stand is 5000 board feet of sawtimber per acre, then the “true” value of the stand is 5 MBF * $100/MBF, or  $500 per acre. That becomes $50,000 for the 100-acre stand.

If your allowable error is 0.1, and your plots are accurate, perhaps your estimated volume would be 4600 board feet (± 460); or, 5400 board feet ± 540.  Scaled out, that could put your estimate of value anywhere from $46,000 to $54,000, with your estimate still falling within the allowable error you specified at the beginning.

But suppose you specified an allowable error of 0.2.  Installing 5 plots would be faster and easier than putting in 17, but your estimated volume could be anywhere from 4200 bd ft to 7500 bd ft.  Your final estimated value could range from $42,000 to $75,000. 

So in this case, if estimating a value of $75K for a stand worth $50K would be acceptable for your purposes, a 20% (0.2) allowable error would be a reasonable choice.  But the “cost” of being wrong would be $25,000; the cost of putting in plots to meet an acceptable error of 0.1 would only be an additional $600.

If measurements from 17 plots and from 4 plots both resulted in an average of 5000 board feet per acre, that would be a value reported as either 5000 ± 1000 board feet, or, 5000 ± 500 board feet.  You can see that the price of that precision is $650.

It’s important to consider the tradeoffs of time spent cruising and the precision and confidence in your results. Keep this in mind when you select the acceptable error and confidence for the next cruise you design!

Friday, April 25, 2014

Setting up a cruise - Estimating Variation

Measuring plots, from a birds-eye view, probably looks a little absurd.  You head for a very specific spot on the ground in the middle of the woods, and that is the “right spot” to begin measurements.  It’s weird to think that going to one particular point is valid, but just a few feet away would bias your sample.  However, we set up your cruise so that it’s important to visit that specific patch of woods and take measurements there, and then move on to the next location. 

So, how do you know where to go?

One approach to designing a cruise is to specify an acceptable level of confidence and error, collect data, and calculate the variance and standard error in the field as you sample.  If variance is too high, you keep adding plots until you reached an acceptable level.  This is somewhat inconvenient, though- it requires you to perform calculations on-the-fly in the woods, and it’s hard to anticipate when you’ll be done cruising on a given day, or in a given stand.  It can also be inefficient, if you add new random plot locations and have to criss-cross the property multiple times.

An alternate approach is to estimate the variation before you enter the stand, and design your cruise accordingly.  That’s the method we employ when you design a new cruise for Plot Hound. Plots are automatically generated along a grid across the stand, and you’ve probably noticed that changing the criteria you specify for variation, confidence, and error changes the sampling design.


Of these criteria, one of the critical decisions you make is your estimate of the variation within the stand.  The estimated variation is where your skill as a forester is really important.  Your familiarity with the forest type and area where the stand is located give you the knowledge you need to make that estimate.  We’re also going to start including your estimated and the actual variation in your reports, to help you “calibrate” your estimates over time.   When estimating variation, also keep in mind the size of the plots you intend to use. On average, there will be less variation between larger (fixed-area) plots than smaller ones.  


The estimated variation options we offer range from 0.15 to 0.55 - even a seemingly uniform conifer plantation or aspen stand has some variation, which is why the lowest possible value is 0.15.

For example, if you knew you were visiting a uniform plantation, like this one:


 pine plantation in central Florida 


You might safely select a low estimated variation, maybe 0.15.

But if you knew that that plantation had experienced heavy mortality, or had a range of soil conditions, you would reasonably expect that there would be a more variation between plots, and more plots would be needed to characterize the range of structure within the stand- then you would select a higher variation.

For example, these two pictures are both taken from the same stand.  There is obviously very high variability within the stand, which would lead to high variation in stocking estimates between plots in these two locations.  More plots would be needed to reach an acceptable level of variance among all plots.

one tree and scattered saplings wide variation in sizes of trees

 Photo credit: Travis Pond, 2010


In upcoming posts, we’ll go into more detail on the implications of selecting the confidence and error values that also contribute to the cruise you design.

Wednesday, April 23, 2014

Maps are Back!

Since switching over to the new site design earlier this year, one of the top requests has been to bring back the maps.  We're happy to announce that the maps are back!

When you go to the Stands or Cruises pages, you'll now see a beautiful big map with markers for each of your stands.  The list of your stands or cruises is now located just a bit farther down below the map.

The new Stands page shows each of your stands on a map

We added a map view to the Cruises page too

Tuesday, April 1, 2014

Search by Address

Creating stands just got even easier.  Type an address.  Zoom to that location on the map.  We have the technology!

Today we're happy to announce that one of your top feature requests is now live.  When you go to the "Create Stand" page, you'll now see a magnifying glass in the top right of the map.  Click on it and then type the address that you want to go to.  Then hit enter and the map will zoom to that location.

Type the address in the new search bar (top right) and hit enter


The map will take you straight there!  
Then draw your stand and you're good to go


We're always working to make Plot Hound better.  Stay tuned for more improvements soon!

Tuesday, March 11, 2014

New Graphs: Confidence Intervals


In this blog post we’re going to explain how a confidence interval is calculated, and show some examples of data that lead to very wide or very narrow confidence intervals. We hope this will help you understand and interpret both the lines on the graphs and the composition of the stands you measure and manage. The graphs we create as part of your free basic report in Plot Hound are a summary of the plots you measured within the stand. The confidence intervals on the graphs reflect the variation between the plots for each species and each size class.


Plot
Spp
DBH


2
4
6
8
10
12
14
16
18
20
22
1
SM
20
16
10
8
6
4
4
2
2
4
2
2
SM
30
24
15
12
9
6
6
3
3
6
3
3
SM
30
24
15
12
9
6
6
3
3
6
3
4
SM
10
8
5
4
3
2
2
1
1
2
1
5
SM
40
32
20
16
12
8
8
4
4
8
4

Confidence intervals reflect the standard error of the average value. For a graph like the one above, the solid line is the average number of sugar maples per acre from all the plots measured. 

We're using a 90% confidence level to determine the confidence interval in these graphs. That means that if you sampled this stand 100 times, you would expect your estimates to fall within the confidence interval above 90 of those 100 times.

We calculate the width of confidence interval by multiplying the standard error (the standard deviation of the mean, divided by the square root of the number of plots) by a statistic (the t-statistic) that is determined by the confidence level we chose.  

So we have two ways of making our confidence interval narrower. One way is to decrease our confidence level. The other is to sample more plots. A 95% confidence level would make the t-statistic larger and the confidence intervals wider; an 80% confidence interval would make the t-statistic smaller and the confidence intervals narrower. However, decreasing the confidence increases the probability that our confidence intervals do not contain the true mean of the population. If more plots are sampled, generally speaking, the confidence interval shrinks. 

- - -


You can control the confidence level and the number of plots, but there's another factor that influences the width of the confidence interval... the "standard deviation" (the variability between plots).


In the example above, all of the plots had differing numbers of trees of each diameter. Suppose that instead, all of the plots had the exact same number of trees measured in each diameter:


Plot
Spp
DBH


2
4
6
8
10
12
14
16
18
20
22
1
SM
20
16
10
8
6
4
4
2
2
4
2
2
SM
20
16
10
8
6
4
4
2
2
4
2
3
SM
20
16
10
8
6
4
4
2
2
4
2
4
SM
20
16
10
8
6
4
4
2
2
4
2
5
SM
20
16
10
8
6
4
4
2
2
4
2


You can see that the confidence intervals are much narrower.  The variance between plots is actually zero in this example, but the confidence intervals are still present because of the smoothing function used in the graph.


We can also see how the graph changes if one plot is very different from the others.  Let’s take the first example plot, but say that no trees were measured in Plot 1, and twice as many were measured in Plot 5.


Now suppose there are twice as many plots in the sample:


Plot
Spp
DBH


2
4
6
8
10
12
14
16
18
20
22
1
SM
20
16
10
8
6
4
4
2
2
4
2
2
SM
30
24
15
12
9
6
6
3
3
6
3
3
SM
30
24
15
12
9
6
6
3
3
6
3
4
SM
10
8
5
4
3
2
2
1
1
2
1
5
SM
40
32
20
16
12
8
8
4
4
8
4
6
SM
20
16
10
8
6
4
4
2
2
4
2
7
SM
30
24
15
12
9
6
6
3
3
6
3
8
SM
30
24
15
12
9
6
6
3
3
6
3
9
SM
10
8
5
4
3
2
2
1
1
2
1
10
SM
40
32
20
16
12
8
8
4
4
8
4

Note that plots 6-10 are the same as plots 1-5, but the confidence interval is smaller because the overall sample includes more data.

- - -


In all of these examples, we’ve been modifying the distribution of one species.  Let’s look at one more example with two species, one common to all plots and one only found in a few plots:


Plot
Spp
DBH


2
4
6
8
10
12
14
16
18
20
22
1
SM
20
16
10
8
6
4
4
2
2
4
2
1
YB
0
0
0
0
0
0
0
0
12
0
0
2
SM
30
24
15
12
9
6
6
3
3
6
3
2
YB
0
0
0
0
0
0
0
0
0
0
0
3
SM
30
24
15
12
9
6
6
3
3
6
3
3
YB
0
0
0
0
0
0
0
0
12
0
0
4
SM
10
8
5
4
3
2
2
1
1
2
1
4
YB
0
0
0
0
0
0
0
0
0
0
0
5
SM
40
32
20
16
12
8
8
4
4
8
4
5
YB
0
0
0
0
0
0
0
0
0
0
0

As you can see, the yellow birch diameter distribution shows up in a different color and style.  As more and more species are added, there is an increasing diversity of colors and styles to differentiate them.  The same reasoning we applied above holds for interpreting the yellow birch confidence interval.

By now you should have a good sense for how the confidence level, number of plots, and stand variability influence your confidence intervals.  Be on the lookout for upcoming posts about sampling and statistics!