
We have just deployed updates to Canopy that give you more control when setting up your cruise! We have had a lot of requests for new features and we have answered the call! Our new updates offer you the ability to set up hexagonal, square, and rectangular grid types as well as random points (1). Rectangular grids offer the ability to manually set the distances between points and lines. Now you can set up any grid spacing you want! Running lines north and south isn’t always the most efficient layout, so we have also built in a grid rotation feature (6). If you are concerned about edge plots (and willing to accept the sampling bias associated with avoiding edge ), we offer you the ability to set an inner bounds buffer where plots won't be allocated (2). As an example if you don't want to take any plots within 25 feet of the stand boundary, just set the inner bounds buffer to 25. Simple as that.
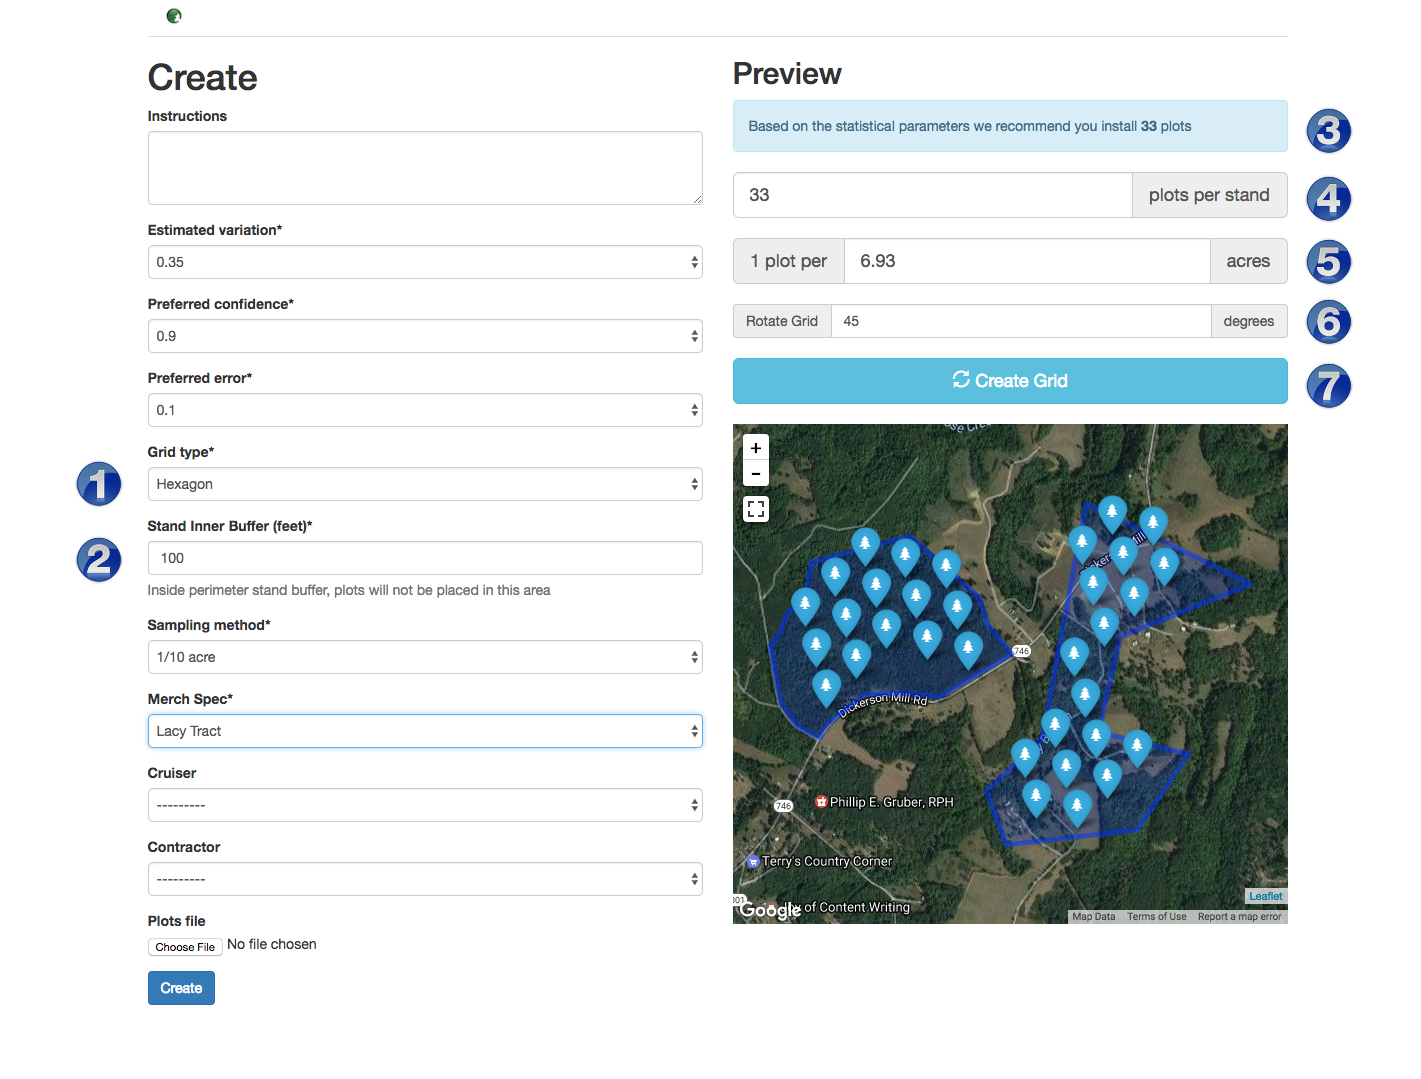
The overall process is slightly different from the previous version, where we would use the statistical parameters you entered to automatically create a grid. Now, instead of automatically setting up a grid, we calculate the number of plots you need based on the statistical parameters and display it above the plots per stand box (3). You then enter the number of plots you would like in the plots per stand box (4). If you have a plot density you want to use, say 1 plot per 2 acres, you can enter that in the plots per acre input box (5) to create the grid. After you set your inputs, just click on 'Create
Grid' (7).
 |
| Top Left - Hexagonal Grid, Top Right - Square Grid, Middle Left - Rectangular Grid, Middle Right - Random Point Grid, Lower Left - Rotated Grid, Lower Right - Grid with an inner buffer applied |
You may notice that sometimes you don't get back the exact number of plots you requested. When laying out grids it is nearly impossible to adjust the spacing so that you come up with the correct number of plots 100% of the time. Our past system worked around this by creating more than enough plots and then randomly dropping some until the right number was achieved. This worked well, but sometimes left weird holes in your grid, and we thought we could do better. This time around we chose not to drop any plots and tried to get the plot count as close as we could. If you are not satisfied with the grid you can simply click 'Create Grid' again, and let the layout algorithm try again.
We are always looking for feedback on how we can improve our system. Feel free to drop us a line at support@silviaterra.com if you have any suggestions or need any help.