Wednesday, August 2, 2017

Virginia Forestry Association talk: Regional Cruise Data Co-ops

SilviaTerra's Forest Technologist Charlie Wade recently spoke at the Virginia Forestry Association's Forestry Summit.  Charlie spoke about creating regional Cruise Data Co-ops for using historic plot data to gain efficiencies in forest inventory work.


Typically, we foresters start from scratch each time we cruise a new stand.  We're unable to use similar cruise data from nearby properties to adjust and optimize our sampling - we start all over again each time we tackle a new project

Cruise Data Co-ops let you rethink this approach - the data you collect becomes part of a shared cruise data library.  Paired with remote-sensing and other statistical techniques, this pooled cruise data can create serious efficiencies for everyone in the co-op.

Cruise Data Co-ops are just one of the many tools we're building to support America's foresters.  If you dream about advancing the state of forest biometrics, we would love to hear from you!  Drop us a line at https://silviaterra.com/bark/jobs.html

Monday, July 17, 2017

Weekly Plot Hound Webinars - Fridays at 4PM ET


We built Plot Hound and Canopy to make cruising fast, simple, and hassle-free.  Over 5,000 cruisers have signed up so far - and we're excited to welcome you as the newest member of the Plot Hound crew.

To help get you in the woods faster we are now offering online Q/A sessions with Plot Hound developers every Friday starting at 4 pm EST.  If you have a question or just want a quick demo of the system feel free to join us!  Topics discussed will include cruise creation, merch spec setup, and Plot Hound use.   

There is no need to preregister.  Just go to https://www.uberconference.com/charlie20 and we will give you a complete walk through of how to start cruising with Canopy and Plot Hound.

Tuesday, July 11, 2017

SilviaTerra Founder Speaks at Yale


Photo courtesy of YEI

SilviaTerra co-founder Max Nova spoke at Yale yesterday to a group of current undergraduate and MBA students in the Yale Entrepreneurial Institute's summer startup incubator program.  He walked the YEI Fellows through the process of taking technology from the lab to the real world.

SilviaTerra's patented technology came from co-founder Zack Parisa's work in Dr. Chad Oliver's lab at the Yale School of Forestry.  SilviaTerra was one of the first ever student-led companies to license intellectual property from Yale, and Max discussed some of the main challenges of turning an academic research project into an industrial-strength, efficient, scalable process.

Seven years ago, SilviaTerra went through the YEI summer program too!  We're very grateful for the support and mentorship we've received from the university and are always excited to pay it forward to the next generation of student entrepreneurs.

Interested in joining our team?
We're hiring!  See our jobs page for details.

Wednesday, July 5, 2017

Western Mensurationists 2017 - SilviaTerra Presentations


SilviaTerra was rolling deep at the 2017 Western Mensurationists conference at UBC this year.  With five biometricians, we were only smaller than the OSU and UBC contingents!

Zack gave a talk on "Deriving better treelists from imagery-assisted cruises" and Brian discussed his PhD work on "Plant traits datasets to improve general individual tree biomass models for natural forest inventories."  It was great to spend a weekend with the West Coast biometrics community and we're looking forward to the 2018 meeting!

Tuesday, June 27, 2017

2017 Q2 All-Hands - Seattle Edition

That's a wrap!  We just finished up our All-Hands meeting in Seattle, WA.  Because we're a totally remote company, every few months we rent a house and all get together to work on new development projects and get some in-person time with each other.

Our team of seven (and a half!) plus our two summer interns
getting a view of the Space Needle and Mount Rainier


This past week, we made improvements to our biometrics codebase and got the new version of Plot Hound prepped for public launch.  We also scheduled out the rest of our 2017 - lots of exciting developments in carbon assessment, open-source forestry tools, and growth modeling coming over the rest of 2017.


Mission success - we escaped the room at Locurio!

We had a great time at All-Hands and our team is growing all the time.  Interested in helping us build the future of forestry?  Check our jobs page for details.

Thursday, June 22, 2017

Optimal Cruising for Your Forest Type

The following post originally appeared in the June 2017 issue of the Forestry Source.  It was written by SilviaTerra's lead biometrician, Dr. Nan Pond.

We're continuing the discussion in the Society of American Foresters's LinkedIn group - looking forward to hearing your questions and comments!


In the March edition of the Forestry Source, we discussed the importance of evaluating inventory decisions in the context of Cost + Loss. How much does a cruise cost to install, and how much do you lose by making imperfect decisions using the information from that cruise?

Taking this a step further, here’s a look at how this works for two different forest types - an upland hardwood forest and an unthinned loblolly pine plantation. In this example, we’ve simulated forest conditions. The upland hardwood forest simulation covers a 65 year old forest with about 150 ft2 of basal area per acre and 150 trees per acre.  The loblolly pine plantation simulation covers a 13-year-old plantation, with a starting TPA of 400 and BA per acre of 160 ft2.

This analysis follows the process outlined in that previous article - identifying a forest condition of interest, finding a similar FIA plot, simulating a forest and then sampling from it, and then growing the forest and the samples forward and comparing management options. Each forest type was tested using 10 different FIA plots and 100 simulations derived from each plot - a total of 1000 simulations each.

The cruising methods compared were the same for both simulations - BAF 10, BAF 20, and 1/10th acre fixed radius plots, installed at 1 plot per 5 acres and 1 plot per 10 acres - a total of 6 different cruise methods. In both forest conditions, the fixed radius plots were the ‘winning’ methodology.  Let’s note now that these results are very context-specific, and depend on the valuation and markets we chose, the discount rate, and the tested management options.

In the upland hardwood example, there was a tie - 4 of 10 FIA plots examined showed that 1/10th acre plots at 1 plot per 10 acres had the lowest cost+loss while another 4 showed the lowest cost+loss as 1/10th acre plots at 1 plot per 5 acres.  For the loblolly plantation, the optimal cruise methodology was 1/10th acre fixed radius plots at 1 plot per 10 acres.

costloss_lowres.jpg

These results may be surprising - they were to us. My coworker even commented that he’d been “cruising plantations wrong for years!”  The common line of thinking is that variable radius plots are faster, and easier. Because of this they’re far more likely to be chosen by cruisers and cruise managers. It’s cheaper to install a variable radius plot, and even more so to use a 20-factor prism instead of a 10 BAF.

In a cost+loss analysis, we’re able to see the real tradeoffs that are made. The trick here is that often, cruising decisions are made looking solely at the cost part of the equation - not the loss. In our simulations, the BAF plots were absolutely the cheapest approach - they take less time to install and involve measuring fewer trees.  However, the loss side of the equation came into play and tipped the scales each time.  In the loblolly plantation simulations, the mean loss from management decisions based on the BAF 20 cruises was on average twice as much as the loss from BAF 10 or the 1/10th acre plots.  Similarly, the BAF 20 cruises had a mean loss of 3 times greater than cruises using  1/10th acre plots.  The BAF 10 cruises showed twice the loss.   

The takeaway from this shouldn’t be “always use 1/10th acre fixed radius plots” - the key is really to think about the tradeoffs being made when choosing a cruising method. The sampling method used is a meaningful and influential decision. A cruise that doesn’t fully represent the conditions in the stand can lead to costly management mistakes.  

The same methodology can be used to evaluate other inventory approaches.  Is it worth incorporating satellite imagery or LiDAR into your cruising process?  Using the cost+loss approach, you can determine whether the increased precision of your cruise (and the resulting improvement in management) outweighs the cost of the additional data inputs. We’ll cover that in an upcoming article.

Monday, June 19, 2017

Our next "Biometrics Bits" article is now available in the Forestry Source!

Our next "Biometrics Bits" article is out in this month's edition of the Forestry Source!  This month, Dr. Nan Pond wrote about "Optimizing Cruising for Your Forest Type."  This article was a followup to our previous article "What is the 'Right' Amount of Information to Collect?" and in it Nan walks us through how that theory could be applied to a Southern loblolly pine plantation.

We've already gotten a bunch of emails about the article - questions about other forest types and sampling methods.  We love thinking about forest inventory - send us your questions at biometricsbits@silviaterra.com and let's talk!


Friday, June 2, 2017

What is the "right" amount of inventory information to collect?

The following post originally appeared in the Forestry Source.  It was written by SilviaTerra's lead biometrician, Dr. Nan Pond.


A BAF 10 plot every 5 acres, or a 20th acre fixed radius plot every 2.5?  A total height on every other plot, or every plot? What kind of inventory should you pay for, and how much does it matter to your bottom line?
Foresters across America have developed rules of thumb that guide how much inventory information they collect.  Because inventories drive management decisions, these informal guidelines play an important but underappreciated role in forestry.  But are those inventory habits actually optimal?  Is there an opportunity to do better?

We all agree that having inventory information is important for making forest management decisions.  Otherwise we wouldn't cruise at all!  But we also know that collecting information has a cost - a cost that must be justified by improvements in management outcomes.  This is why we measure sample plots rather than conducting a census of every tree - the value of the additional information does not pay back the cost of collecting it.

 Max_figure.png

But there is a cost to having imperfect information.  If we had a perfect information - a complete census - about our forest, we could feed that data to an optimal harvest scheduler and it would give us the best possible management plan.  When we have imperfect information, our harvest scheduler will make some "mistakes" that cause us to harvest some areas too early and others too late.  The more imperfect our information, the more mistakes we'll have in our management plan.

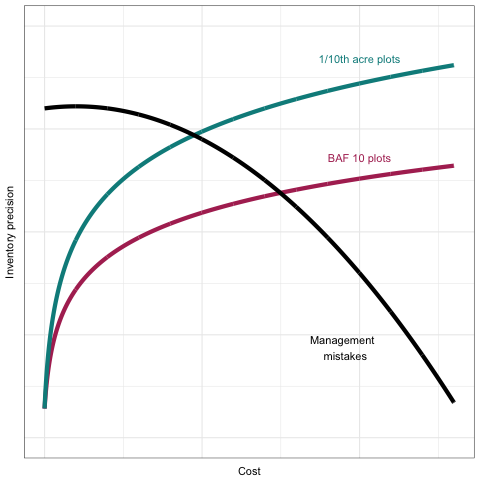
Like most things in life, finding the optimal level of inventory information to collect is all about tradeoffs.  The key question is: "at what point does spending an additional dollar collecting inventory information no longer prevent more than a dollar of management mistakes?"

This turns out to be a challenging question to answer.  While it's
straightforward to know how much we are spending on inventory for a given level of precision (the red and green lines), how do we quantify the cost of the "mistakes" in our suboptimal harvest schedule (the black line)?  There are all sorts of variables that come into play, including forest type, age, product prices, growth predictions, etc.  Until now, no one has been able to come up with a clear way to answer this important question across the US.  In a 2008 paper called "The Value of Timber Inventory Information", Borders et al. discuss the tradeoffs of cost and imperfect information (“cost+loss”) in loblolly pine plantations and natural stands. This paper gives a great economic analysis, but that doesn’t help you decide how many plots, and what type or size of plots to install in your forest!
 stemMap.png
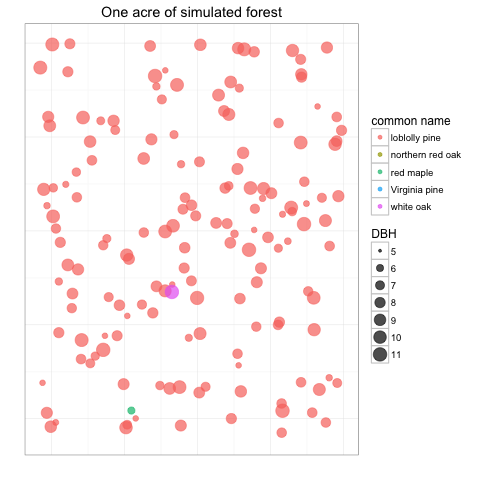
However, it turns out that we can use the excellent USFS FIA dataset and some clever coding to get to the bottom of this.  The beauty of the FIA dataset is that it has spatially-explicit stem records (as shown in the diagram on the left).  For any region in the US, we can use a collection of nearby FIA plots as a sort of "seed" for simulating a "virtual forest"

We now have perfect information for our virtual forest and can feed that information to a harvest scheduler to develop the optimal management plan.   In this example, the harvest scheduler tells us we'll make $100K in profit.

forestMap.png

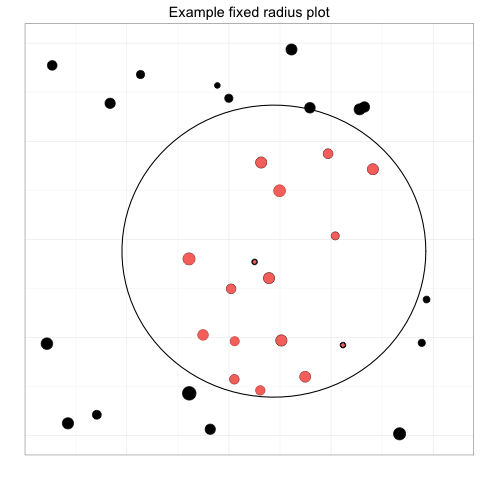
Now here's the cool part - we can simulate cruising our virtual forest.  For example, we could lay out 50 1/10 acre plots and see which trees are included in each.  Then we use those plots to work up a cruise summary just like for a regular cruise.

We run the cruise summary through a harvest scheduler and it returns a management plan.  But unlike our optimal management plan from before, this management plan is based off of imperfect information.  That means we are almost certainly thinning some stands too early and others too late.

And we can find out!  We apply the harvest schedule to our virtual forest and in this example, we end up with $90K in profit - $10K less than the perfect information optimum. Again, that means that we lost $10K because the information we bought was imperfect. We can do better, with better planning.

fixedRadPlot.png

If we try again with 70 plots, we might find that we pay $500 more for those 20 extra plots, but end up with $92K in profit because we avoided a couple of management mistakes.  The extra plots were worth it.

Using this method, we finally have a quantitative approach for making decisions about our inventory design.  It's possible to simulate a range of sampling methodologies and see which is the most appropriate for our different forest types and management practices.  This method is also easily extensible to include other aspects of our inventory or planning processes.

By directly relating our sampling methodology to our profitability, this approach lets us identify opportunities to improve our forest management while adding to the bottom line.  There's much more to say about the results of this approach in different forest types - and recommendations we’ll make - stay tuned for more biometrics analysis in next month's issue!


Works Cited
B. E. Borders, W. M. Harrison, M.L. Clutter, B. D. Shiver and R.A. Souter. 2008. The Value of Timber Inventory Information. Can. J. For. Res. 38: 2287-2294.

Monday, May 22, 2017

Presenting at ACF 2017 in Tahoe

Greetings from the beautiful shores of Lake Tahoe!  We're exhibiting at the Association of Consulting Foresters meeting in Incline Village, Nevada.  We're giving lots of demos of the new Plot Hound customization features and our new and powerful (and free!) plot layout tool in Canopy.  We're also excited to be bringing the power of remote-sensing to all consulting foresters with our CruiseBoost service.  We've spent the last year automating much of our satellite image analysis so that foresters working on properties as small as 40 acres can still take advantage of the power of remote sensing.

It's always great to meet consulting foresters using Plot Hound and CruiseBoost to make their inventory work easier - swing by the booth if you're in town!

SilviaTerra founders Max and Zack
trying to figure out what to do with their hands

Thursday, May 18, 2017

Plot Hound is turning 6, and we're celebrating with a brand new version!


Screen Shot 2017-04-28 at 6.18.54 PM.png


For the last six years, SilviaTerra has been striving to build the best possible mobile cruising experience. Our 100% free Plot Hound application has been put to use in plots across the country (and the world!), with continuous improvement that has only been possible thanks to the feedback and suggestions from the thousands of cruisers who have used Plot Hound.

That’s why we’re excited to announce that we’ll soon be making Plot Hound ever better with a major new release. Version 6.0 will be out this summer, and it’s packed with new features. The biggest change is custom data types and validation. This means you’ll have the ability to go beyond a few generic data entry fields, increasing flexibility and reliability of your data. We know every cruise is different, and now that Plot Hound is being used all over the world it’s more important than ever that we can tailor the cruising experience to you.


Want to use the new Plot Hound on an upcoming cruise? Feel free to reach out to us at support@silviaterra.com. We’re now officially opening the version 6 beta signup - for both Android and iPhone.

New to Plot Hound? Find out more at https://silviaterra.com/bark/plothound.html

Monday, May 15, 2017

Launching the "Biometrics Bits" column in the Forestry Source

forestry-source.jpgWe're excited to announce that the SilviaTerra biometrics team just published its first "Biometrics Bits" column in the Forestry Source - the Society of American Foresters newspaper. Our first article explored the question - "What is the 'Right' Amount of Inventory Information to Collect?"

Using the fantastic FIA dataset, SilviaTerra's Lead Biometrician Dr. Nan Pond simulated many different cruising methods and intensities. Using this approach, we arrived at a rigorous and quantitative answer to the question "when does spending an additional dollar on inventory result in less than a dollar's worth of better management decisions?" in a variety of forest types in the US.

We're excited to share our thoughts on biometrics with the wider forestry community - stay tuned for plenty more articles!

Monday, May 8, 2017

Brian Clough joins SilviaTerra


The SilviaTerra team is thrilled to announce our newest member, Dr. Brian Clough.  Brian comes to us after completing several years of postdoctoral research at the University of Minnesota.  He brings a great set of skills to complement our current biometrics team, including experience with biomass and carbon modelling, and a solid background in Bayesian modelling techniques.  


Brian is originally from the northeastern US, where he earned his PhD in Ecology and Evolution at Rutgers University.  SilviaTerra’s remote work system will allow him to continue to call Minnesota home for the time being. He’s already hard at work improving our automated height modelling systems, along with learning about the rest of our systems.  Welcome, Brian!

Some of the SilviaTerra team, together for a recent development week
(L:R Nan Pond, Mike Holkesvik, Brian Clough, Henry Rodman)


Thursday, March 23, 2017

SilviaTerra founder speaks at Center for Business and the Environment at Yale 10 year anniversary @ Google SF


SilviaTerra founder Zack Parisa spoke yesterday at the Center for the Business and the Environment at Yale 10 year anniversary event hosted at the Google San Francisco office.  Other speakers included Dr. Indy Burke, the Dean of the Yale School of Forestry & Environmental Studies and Stuart DeCew, the Director of CBEY.

Zack spoke about how SilviaTerra originated from his Yale M.F.S. thesis work on helping rural Armenian villages manage their forests better.  Without accurate and recent forest inventory information, any management planning was useless.  In response, Zack developed what became the core SilviaTerra satellite imagery analysis technology so that he and his small team of local foresters could develop a forest inventory data layer across much of the country.

The focus on enabling better management decisions has been at the heart of SilviaTerra since the very beginning.  From our original work enabling villagers in Armenia to manage their firewood supply to helping many of the largest American environmental and industrial landowners achieve their conservation and production goals, SilviaTerra has always been driven by the idea that better data can enable better decisions.  Zack described how richer information about our forests is enabling the valuation and management of new, non-fiber ecosystem services and the role that information-providers like SilviaTerra play in building a future where our forests are managed efficiently, accurately, and equitably.

If that sounds like a future you'd like to help build - we're hiring!

Thursday, March 9, 2017

SilviaTerra Spring Conference Schedule


Great meeting lots of current and future 
Plot Hound users at NESAF 2017

Greetings from the New England Society of American Foresters meeting in Bangor, Maine!  SilviaTerra is on the conference circuit this month - come swing by the booth and say hi:

  • New England SAF - March 8-10
  • Inland Empire SAF - March 27-28
  • Washington SAF - March 29-30
  • Timber Measurements Society (Portland) - April 12-14
  • Oregon SAF - April 26-27
  • Virginia ACF - May 3

Thursday, March 2, 2017

Mike Holkesvik joins SilviaTerra

We're excited to announce the newest member of the SilviaTerra team - Mike Holkesvik!

Hailing from South Dakota, Mike grew up where the deer and the antelope play. He spent his childhood in the great outdoors, whiling away afternoons fishing, hiking, and reading old books.


Mike's interests include fishing, hiking, and... FALCONRY


Mike earned a degree in Computer Science from Yale University, where he met SilviaTerra founders Zack and Max. At the time, Mike was channeling his love of the outdoors into a website that helped people find great hunting guides. After graduating, Mike worked as a software developer for Redfin - a technology-driven real estate brokerage startup in Seattle.

The Yale Alumni Magazine featured Mike's 
"Mongol Rally" team on the cover - epic!


Immediately prior to joining SilviaTerra, Mike drove ten thousand miles from London to Mongolia in the Mongol Rally. His team - the "Bad Latitudes" - was the largest team in event history. After countless flat tires, car breakdowns, and narrowly-avoided international incidents, they successfully made it across to the finish line.

At SilviaTerra, Mike will be working hard to make us faster, better, and stronger.  Keep an eye out for lots of improvements, speedups, and new features.  Welcome aboard Mike!


Tuesday, February 28, 2017

2017 Q1 All-Hands

Every quarter, the fully remote SilviaTerra team assembles from all corners of the world, rents a house, and spends a week building new features and planning future conquests.

The SilviaTerra squad manages to not fall into any canals
Thanks to Travis Pond for his services as the SilviaTerra team picture guy!

We just wrapped up our 2017 Q1 All Hands in The Hague, Netherlands.  This was our first All-Hands meeting outside of the US and it was a great success.  No one fell into any canals, although apparently about a car a week does in the Netherlands!  In addition to the sightseeing and delicious Dutch food, we made major technical progress on:

  • The upcoming version of Plot Hound with customizable data entry
  • Improvements to CruiseBoost for both large and small properties
  • Change detection using a variety of imagery platforms

If that sounds like a good time to you, we'd love to meet you!  Drop us a line at https://silviaterra.com/bark/jobs.html

Thursday, February 16, 2017

Stumpage Value and Product Groups for Merch Specs

We're dedicated to the foresters we serve and we're always investing in Plot Hound and Canopy to make them better and more useful tools.  Since we launched our merch specs system in late 2015, we have had many great conversations with foresters across America who use Plot Hound and Canopy as their main cruising platform.  The top two requests we heard were product groups and stumpage pricing.  Starting today, both of those features are live!


The "Product Group" field allows you to assign each of your products to a product group.  If you have a volume subscription, your volumes will now be summarized by both product and product group.  This works great for cases where you want rollups of general product groups like Sawtimber that contain distinct products like Pine Saw and Hardwood Saw.

You can also now assign a stumpage value for each of your products.  If you are signed up for one of our volume reporting service, your reports will include a summary of stumpage value by product and product group.

We've also invested in some performance engineering on the backend, so the merch specs page is faster than ever. Our mission is always to save you time on the computer you can spend more time in the woods and with your clients.

We are always looking for feedback on how we can improve Canopy and Plot Hound.  Feel free to drop us a line at support@silviaterra.com if you have any suggestions or need any help.

Monday, January 9, 2017

Revamped Cruise Setup

We have just deployed updates to Canopy that give you more control when setting up your cruise!  We have had a lot of requests for new features and we have answered the call!  Our new updates offer you the ability to set up hexagonal, square, and rectangular grid types as well as random points (1).  Rectangular grids offer the ability to manually set the distances between points and lines.  Now you can set up any grid spacing you want!  Running lines north and south isn’t always the most efficient layout, so we have also built in a grid rotation feature (6).  If you are concerned about edge plots (and willing to accept the sampling bias associated with avoiding edge ), we offer you the ability to set an inner bounds buffer where plots won't be allocated (2).  As an example if you don't want to take any plots within 25 feet of the stand boundary, just set the inner bounds buffer to 25.  Simple as that.

plot_shot.png


The overall process is slightly different from the previous version, where we would use the statistical parameters you entered to automatically create a grid.  Now, instead of automatically setting up a grid, we calculate the number of plots you need based on the statistical parameters and display it above the plots per stand box (3).  You then enter the number of plots you would like in the plots per stand box (4).  If you have a plot density you want to use, say 1 plot per 2 acres, you can enter that in the plots per acre input box (5) to create the grid.  After you set your inputs, just click on 'Create
Grid' (7).

Top Left - Hexagonal Grid, Top Right - Square Grid,
Middle Left - Rectangular Grid, Middle Right - Random Point Grid,
Lower Left - Rotated Grid, Lower Right - Grid with an inner buffer applied

 You may notice that sometimes you don't get back the exact number of plots you requested.  When laying out grids it is nearly impossible to adjust the spacing so that you come up with the correct number of plots 100% of the time.  Our past system worked around this by creating more than enough plots and then randomly dropping some until the right number was achieved.  This worked well, but sometimes left weird holes in your grid, and we thought we could do better.  This time around we chose not to drop any plots and tried to get the plot count as close as we could. If you are not satisfied with the grid you can simply click 'Create Grid' again, and let the layout algorithm try again.

We are always looking for feedback on how we can improve our system.  Feel free to drop us a line at support@silviaterra.com if you have any suggestions or need any help.