Monday, June 30, 2014

Dropping incomplete plots

Starting today, you'll be able to drop incomplete plots from a cruise.  When you go to a cruise page on the website, you'll see a new orange button "Drop incomplete plots" that shows up after you've completed at least one plot.


A word of warning though - you may bias your sample by dropping plots.  Unless you're dropping plots in a completely random or completely systematic manner, you are likely biasing your sample.

So if you drop every third plot, your sample will be unbiased (although you may not hit your target accuracy and confidence for the cruise).

However, if you drop all the wet plots, the plots furthest from your truck, or plots with bees on them, you are biasing your sample.  In that case, the estimates derived from your cruise data would be for a population that did not include the areas you chose not to sample.  This is likely not what you want!

Friday, June 20, 2014

Manage groups of stands with tags

More and more large forestry companies have started using Plot Hound to collect their cruise data.  We've received many requests for a better way to organize groups of stands into units like "Northern Section", "2014 Harvest", "Smith Property", and "Restricted Stands."  Today, we're announcing "tags" - a new feature that makes it easy to organize your stands.

You can think of tags as like fields in your GIS attribute table, only more intuitive. You can add the same tag to multiple stands, which allows you to easily group related stands, strata, blocks, owners, forests, you name it!


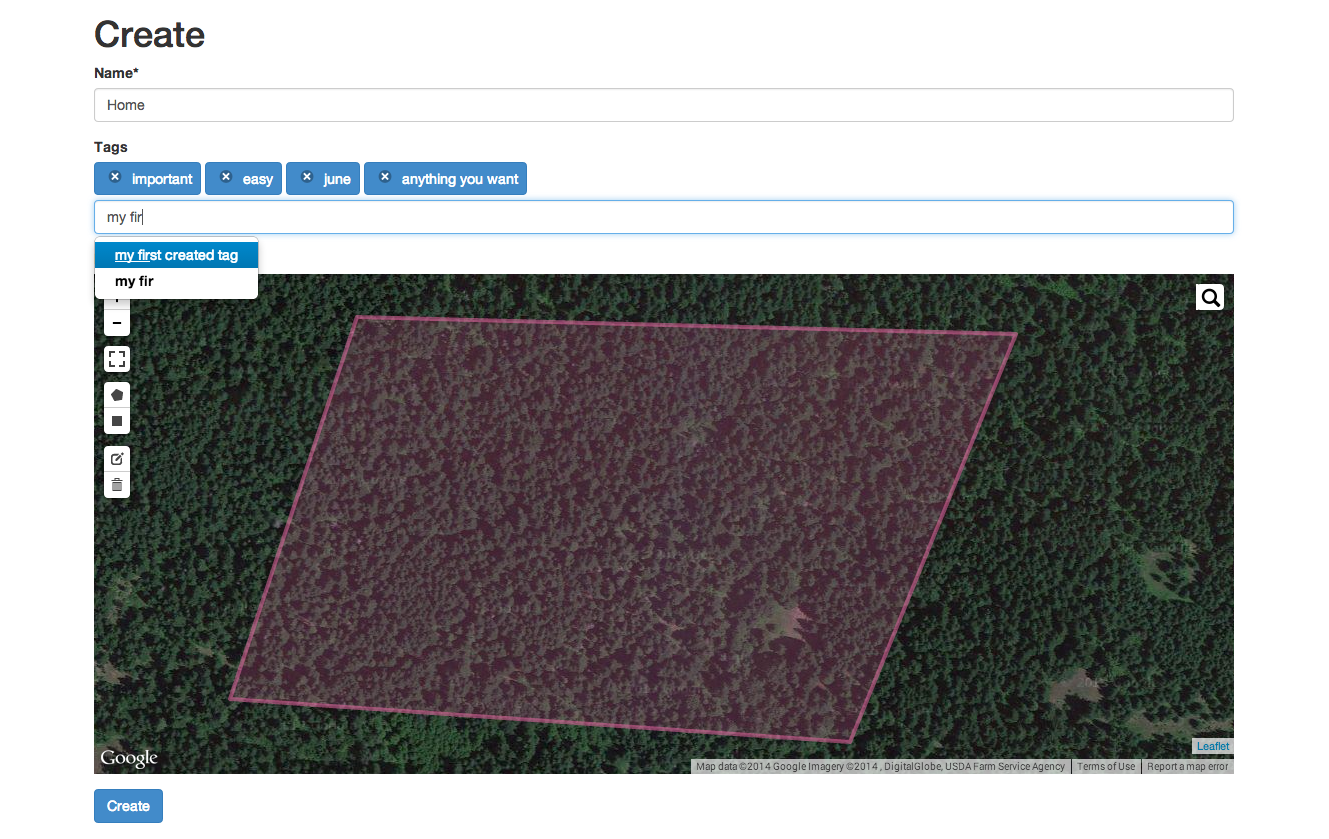
When creating a stand, you can start typing and create any tag you would like. If you have already created a tag all you have to do is type a few letters and the drop down box will suggest tags that you have already created with a similar name, or you can create a tag with a new name. To create or select a tag, just click the choice from the drop down, or press enter/return on the highlighted choice.


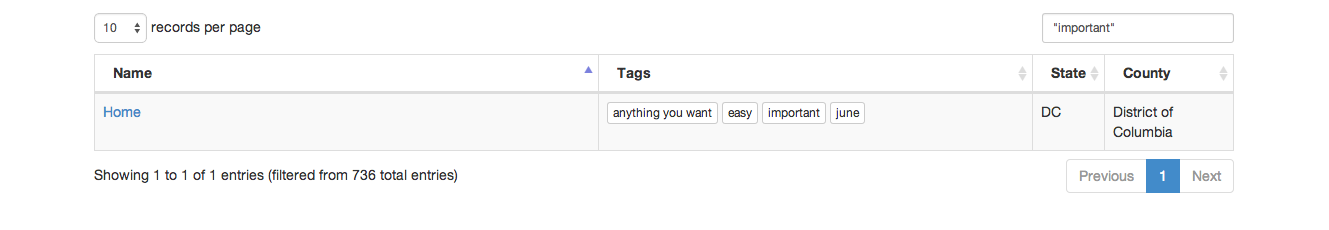
On the stand and cruise page, you can now also use the search box to search for tags. Tags will be displayed in the new column titled tags.


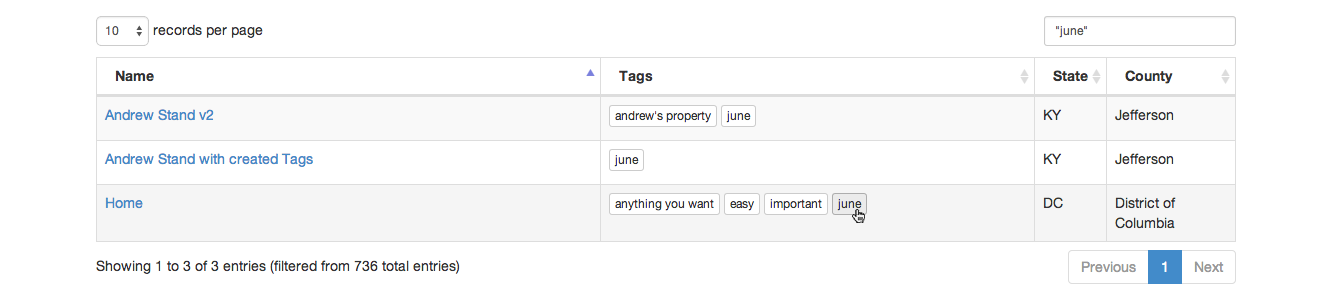
If you click a tag from the column, it will automatically search for other items with that same name. This makes it easy to see multiple stands with the same tag. 


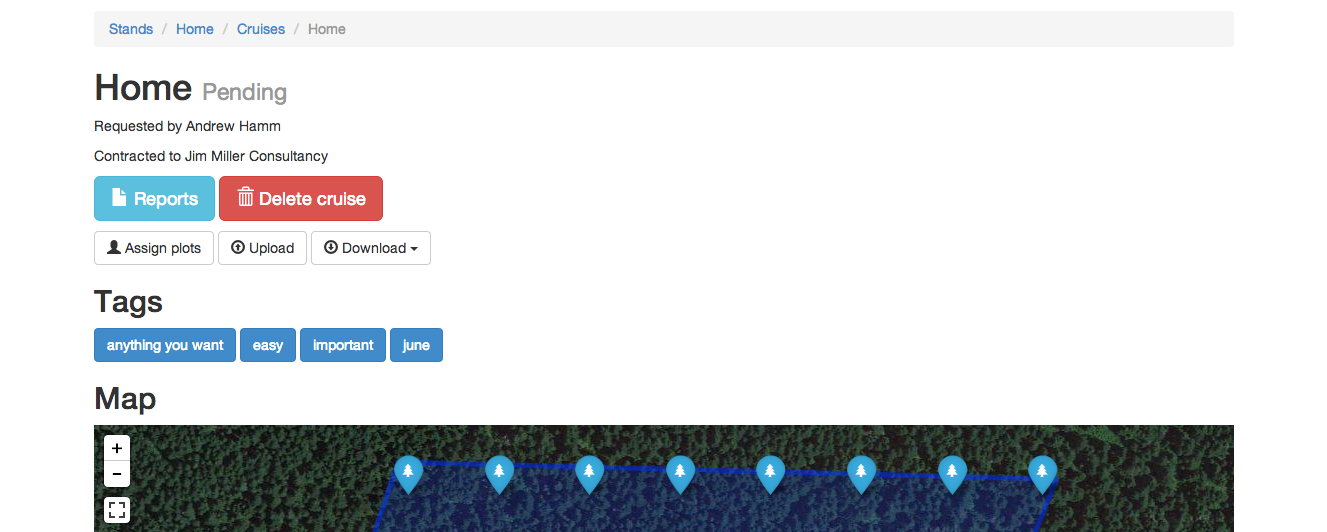
On the cruise list and detail page, you will be able to see the tags of the stand which that cruise belongs to. If you click a tag on the cruise detail page, it will take you to the cruise list page, and filter the cruises table to show you other cruises whose stands have the same tag.


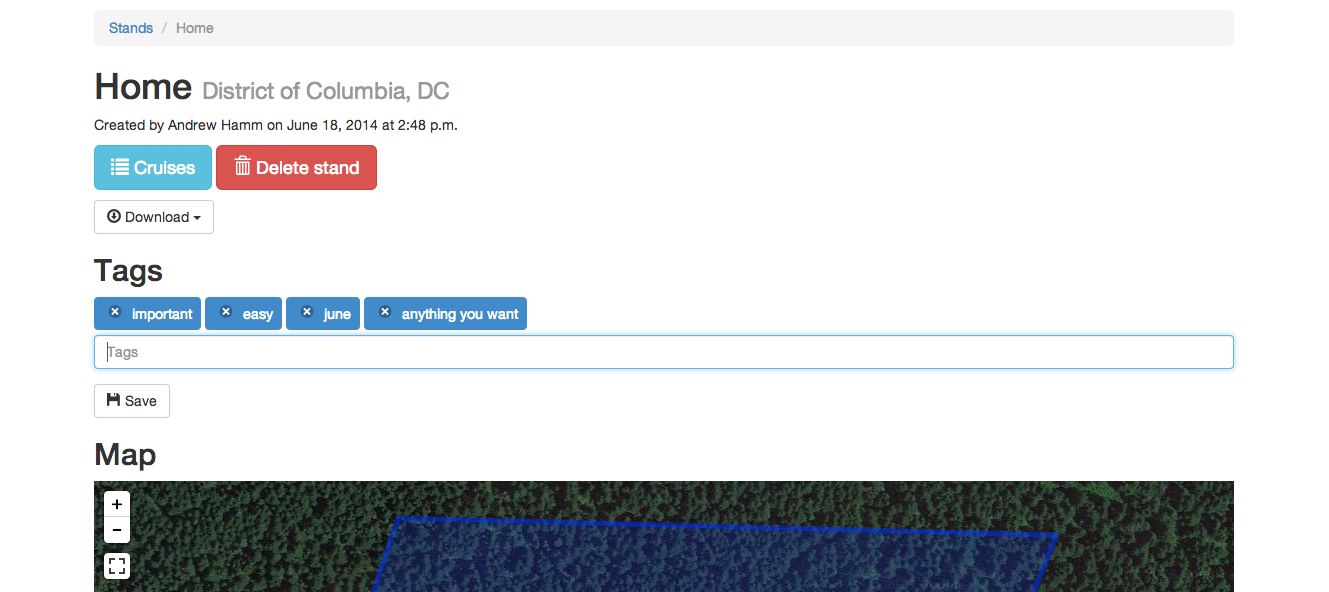
You can remove or add tags on the stand detail page too.  To remove a tag, simply push the "x" button next to the tag name. To add a tag, just type the name of the tag you would like to add or create and select it from the drop down. Once you are satisfied with your edits, push save and they will be applied. If you click on a tag from this page, it will take you to the stand list page, and filter the stands table to show you other stands with the same tag.

We're excited to see how you use tags.  As always, please tell us what you think in the comments section below!

Tuesday, June 17, 2014

Setting up a cruise: Bringing the pieces together

In recent posts we’ve talked about how the set-up of a cruise is influenced by your requirements for confidence and error, and the variation you anticipate in the stand.  The total number of plots in a cruise is calculated using a standard sample size formula, which you might remember from a forest measurements class:


n = ( t * CV )2
A


Or, in simpler terms:


number of plots = ( t-statistic * Coefficient of variation )2
Allowable error

The t-statistic comes from the level of confidence you specify.


The criteria you specify are used in that equation to determine the final number of plots- generally, here’s how that works:


More plots:
Fewer plots:
Higher confidence required
Lower confidence required

Because the t-statistic (reflecting confidence) and the estimated variation are multiplied, if you require a high level of confidence in results from cruising a highly variable stand, the number of plots required will be much larger than if you need an estimate with lower confidence, or if the stand is less variable. The final plots are then located in a grid across the stand. 


Once you know where to go, the next challenge becomes how to decide what data to collect and what plot design to use- fixed area plots, or strips of varying sizes, or a variable-radius plot.  We’ll get into that in a future series of posts!